
PH Merchandise Trade (in US$M) 2014-2018 with the UK
| 2014 | 2015 | 2016 | 2017 | 2018 | |
| Exports | 460.73 | 499.59 | 501.06 | 522.21 | 534.89 |
| Imports | 385.62 | 398.66 | 509.18 | 521.61 | 685.10 |
| Total Trade | 846.35 | 898.25 | 1,010.24 | 1,043.81 | 1,219.99 |
| Balance of Trade | 75.11 | 100.93 | (8.12) | 0.60 | (150.21) |
Sources: DTI-Tradeline Philippines[1]
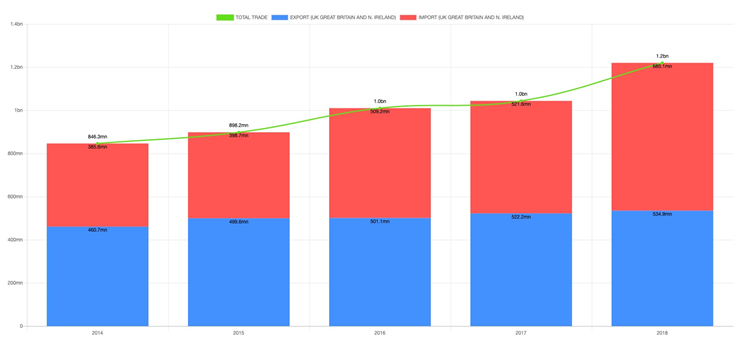
• The compounded annual growth rate (CAGR) of the PH merchandise for the total trade to the UK from 2014 to 2018 is at 9.6%. During the same period, the CAGR for import is 15.5%; whilst for export is at 3.8%.
• The top 5 PH exports over the past five years are: a) electronic products (↑7.6%); b) machinery and transport equipment (↓ 11.1%); c) other manufactures (↑ 9.2%); d) tuna (↑ 12.8%); and e) processed food and beverages (↑ 13.4). 2
• Meanwhile, the top 5 imports in 2018 are: a) optical, photographic, measuring or surgical instruments and apparatus; b) miscellaneous manufactured articles; c) furniture, bedding, mattresses; d) toys, games and sports requisites; and e) commodities and transactions not classified elsewhere.3

Recent Comments